

- XRP dropped to $2.14 amid declining market confidence. Derivatives data showed a 2.66% dip in Open Interest and significant liquidation of long positions.
- Technically, XRP is trading near critical support levels, with immediate zones at $2.11 and $2.14.
Wednesday was a bullish day for Ripple’s XRP, which hit intraday highs of $2.30 in the midweek. The rally is part of increased positivity in the crypto space, feeding off the better geopolitical resonance. U.S. President Donald Trump’s softened rhetoric toward Federal Reserve Chair Jerome Powell and more positive tone toward discussions with China lifted investor sentiment. As a result, digital asset prices across the board rallied on the hopes of easing tension, and progress was perceived.
XRP Price Sees Rollercoaster Ride
However, by Thursday, the pressure was back on XRP, losing to just below $2.14 during the European trading session. Nonetheless, the pullback itself is a signal indicating a change in sentiment across the entire crypto market with respect to short-term bullish momentum.
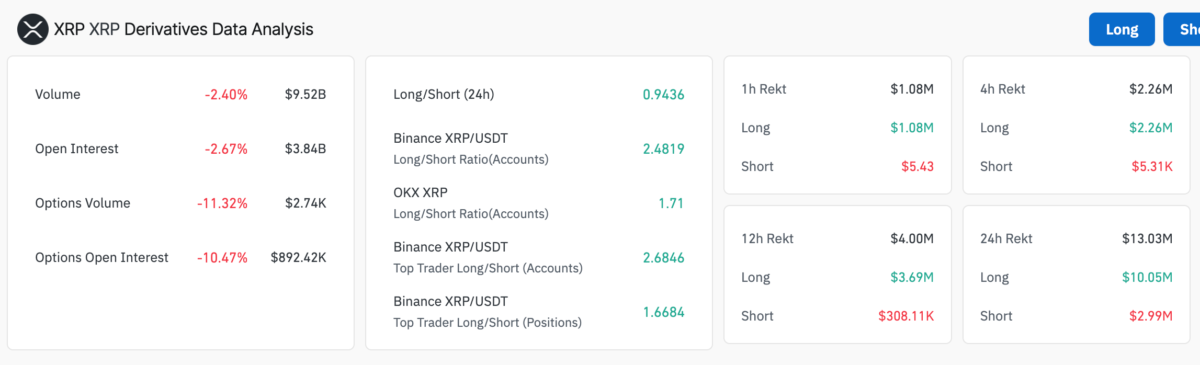
CoinGlass data shows that XRP’s derivatives metrics have made a sharp decline. The Open Interest (OI), a gauge of active futures contracts, is down 2.66 per cent in the past 24 hours to $3.84 billion. A drop, however, is a reflection of the less appetites of speculators, that is, less trader confidence and a possible decline in trading activity.
Along with the OI dip was a huge wave of liquidation. The long positions took a beating, and $10.05 million worth of leveraged buy trades were closed forcefully. Short liquidations, however, were seen by far lower numbers, around $3 million. Such an imbalance reflects the speed of a correction and an inflated number of selling activity, with bullish bets taken by surprise by market reversal.
Further signals indicate that the market is cooling. Rising 24-hour long/short ratio reached 0.9436 for XRP, indicating a higher growing bias in bearish positions. The volume of overall trading dropped 2.4% to $9.52 billion, adding even more evidence so far that fewer people are engaged.
XRP Price Prediction: Key Levels To Watch

On the technical side, XRP price currently trades above the key moving average support levels. Recently, it has been tested at $2.11 on the 8-hour chart on the 50-period Exponential Moving Average, and it is close to the simple 100 Exponential Moving Average at $2.14. These indicators are immediate zones of support; failing here could put the price at risk for further decline.
Meanwhile, market watchers are now observing the Relative Strength Index (RSI) as it is currently at 52.42. Slower from a bearish momentum, the RSI appears positioned near the middle, and thus the market could swing either direction in the short term. As of yet, $2.00 serves as the critical support below the current levels, which has served as a key support since March. If XRP price breaches this level due to deeper pullbacks, it could hover around the April low near $1.62.