
- Uniswap is in untraded territory with a bearish outlook at the moment.
- The leading indicators suggest a spike is likely to occur in the next few weeks.
Uniswap (UNI) has not enjoyed the best of times in the market lately as it has dropped as much as 50% over the past month, a reverse gear shift that suggests that its core users are bearish on its price outlook. Despite playing a pioneering role in the Decentralized Exchange (DeFi) ecosystem, Uniswap has failed to move along with some of its high-performing gear.
Uniswap in the Market: What the Charts Say
Uniswap is yet to recover from the lows of the prolonged crypto winter. During this time, the UNI price slipped from a high of $44.97 reached on May 3, 2021, to a low of $3.76 reached over the past year.
So far this year, there has been a thorough recovery in the market, but it has not spread to Uniswap. On-chain data shows UNI has managed to achieve 16.16% growth in the last 3 months. This spike comes from a growth of 76.06% over the past 6 months. Currently, a monthly drop of 50% is considered a stress test that could make or break the token in the future.
At the time of writing, Uniswap changed hands for $7.54 after pocketing a 1.33% drop over 24 hours. Determining the next price direction depends on various factors ranging from the broader market sentiment, its technical indicators, and the role of important key support and resistance points.
Investor sentiment is currently restarting in light of the general expectation that Bitcoin’s recent halving event will help change market dynamics. The halving itself was negative news for miners whose rewards are now halved. However, the resulting scarcity is poised to drive the price spike higher as spot Bitcoin ETFs sustain demand.
If Bitcoin prices surge, there is an expectation that altcoins will join in and Uniswap will benefit in the end.
Technical Points and UNI Support
At the time of writing, Uniswap’s Relative Strength Index (RSI) is pegged at 33, indicating near oversold. This indicator suggests there is a possibility of a trend reversal in the near future. The Moving Average Convergence Divergence is also currently crossing bearish as shown on the chart. If the key indicators remain encouraged, then there will officially be a bullish cross-over which may also be followed by a price increase.
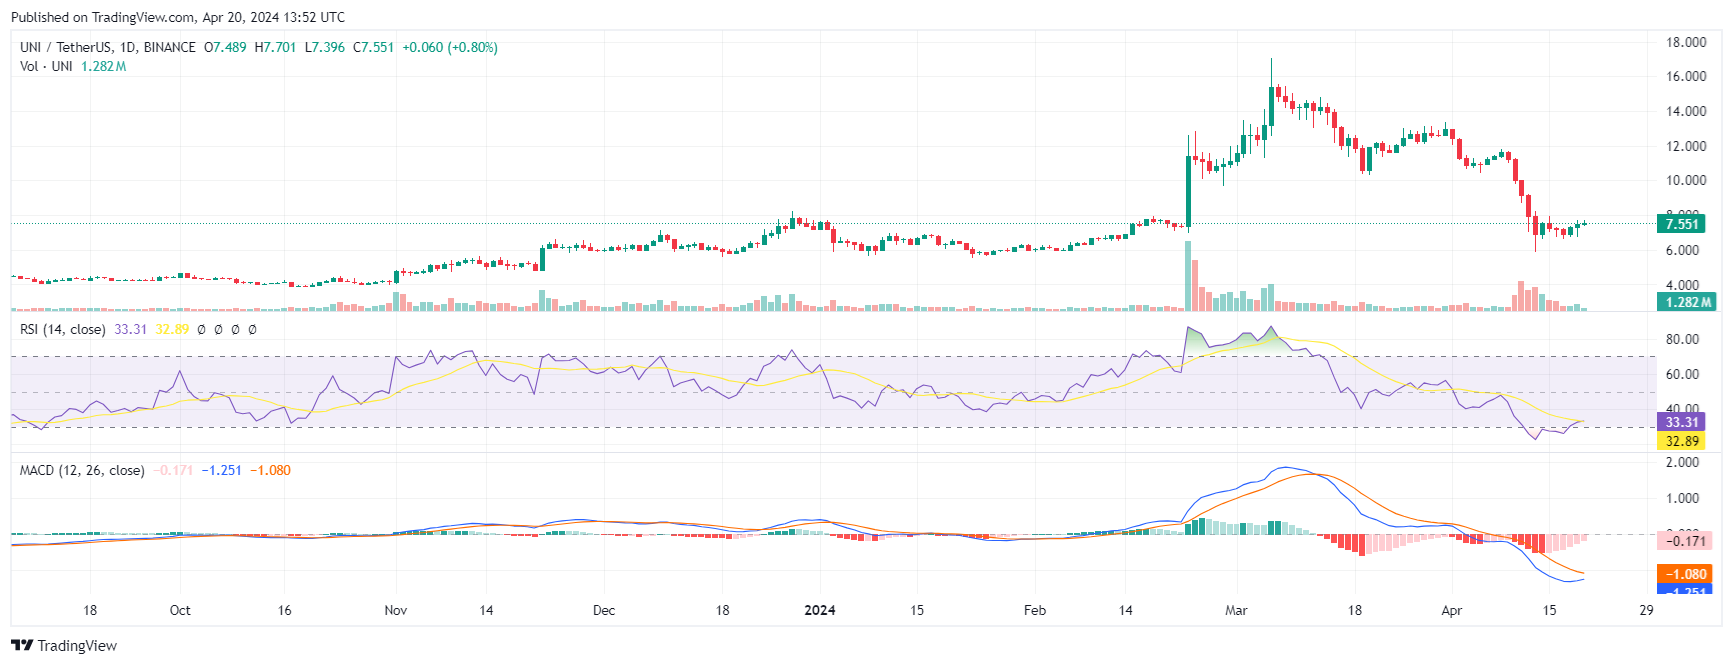
Currently, the UNI support zone is pegged at $6 while the Fibonacci resistance zone is pegged at $8,615 or $12. One of the major consolidation attempts seen at the moment hinges on the factors driving UNI demand.
As the dominantDecentralized Exchange (DEX), Uniswap continues to lead high volumes across exchanges. Protocols like Base, Optimism, and Arbitrum are also driving large volumes which could put upward pressure on the price.
Aside from unpredictable market shifts, the only hindrance to Uniswap according to previous reports is the potential lawsuit that may be filed against the exchange by the United States Securities and Exchange Commission (SEC)
Subscribe to our daily newsletter!
No spam, no lies, only insights. You can unsubscribe at any time.


 Competitors That Could Multiply $3,000 Into $250K by September 2025")