

- Litecoin is experiencing a major bear pressure Post-halving.
- Several technical indicators suggests a bearish dive in Litecoin might be underway.
Since the Litecoin (LTC) halving event which happened on August 2nd, the coin has not shown significant progress especially as it concerns its price growth.
The LTC coin has encountered several price dips and fluctuations which is causing a loss of interest from investors. According to IntoTheBlock (ITB) data from the second week of September, Litecoin transaction volume was around $1.5 billion a day and this was highlighted as the platform’s lowest since August 2021.
While the coin surprisingly recorded a double-digit gain of up to 13% last week, this has made no much impact to the bottomline as data points to the fact that it dipped to its 2023 low on September 13th when it traded at $60. Between September 16th and 17th, LTC saw a bit of short-term sell pressure which suggests it may lose some of the recent gains many in the ecosystem might be celebrating.
With short-term sell pressure, the price of LTC dipped further and is projected to drop by an additional 5% from current levels. At the time of this writing, Litecoin was trading at $65.15 after gaining 1.60% in the past 24 hours.
Litecoin Technical Indicators Gives Mixed Signals
According to on-chain indicators presented in the chart below, the sudden price reversal was observed to have occurred near the H12 bearish Order Block (OB) of $67.2 – $68.4.
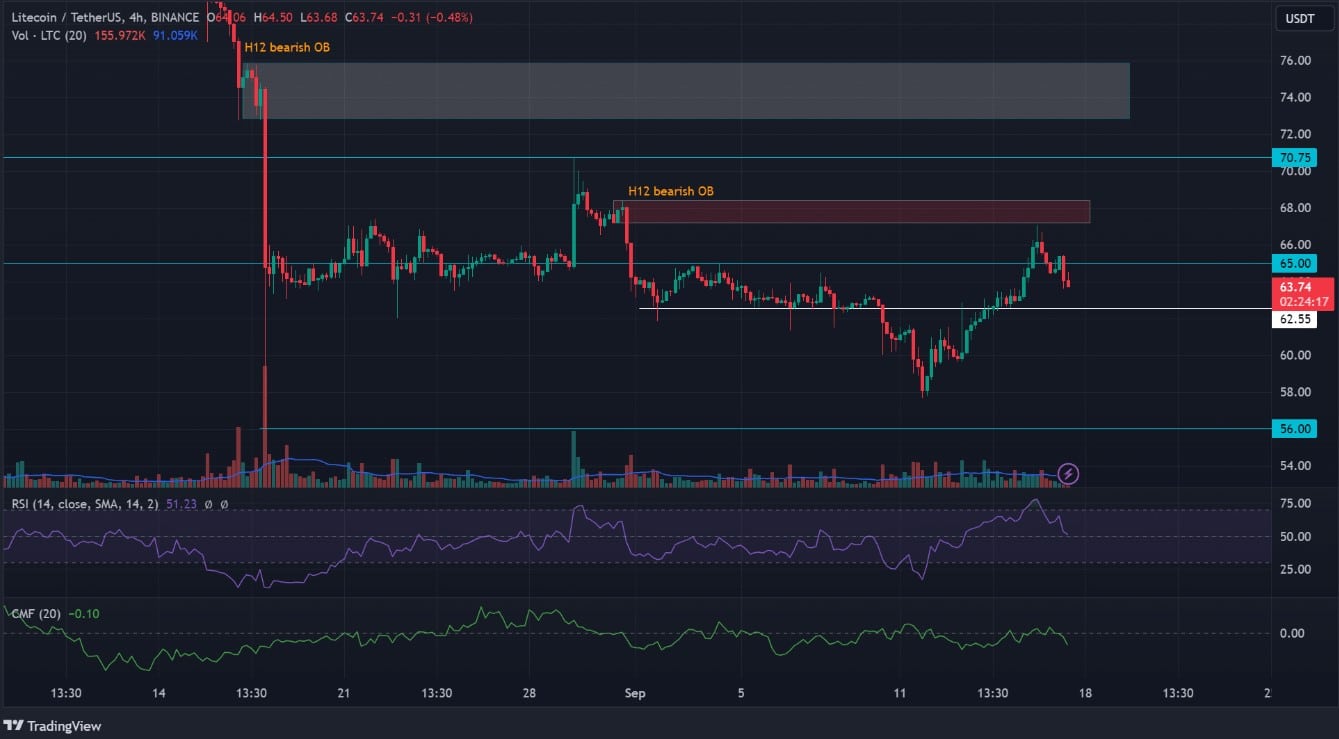
Some sources believe that the next crucial support for Litecoin is between the $60 – $62.55 levels. This would mean that the pullback could release its pressure at $62.55 or even $60 before attempting another price surge, especially if the Federal Open Market Committee (FOMC) meeting which is scheduled to be held on September 20th takes a dovish stance.
In the case of the potential leg up, the key target levels for bulls will be a conservative $70 and a more bullish level at $80. Notably, the Relative Strength Indicator (RSI) which usually signifies if an asset is overbought or oversold, eased to the 50-equilibrium mark, a trend that confirms that LTC price can move in either direction depending on the external fundamentals acting on the coin.
Some other on-chain indicators are indicative of a bear movement. The Chaikin Money Flow (CMF) had earlier breached and extended below zero and this reinforced a dip in capital inflows over the weekend.
On the other hand, the Cumulative Volume Delta (CVD) went through a positive slope and this further underscores buyers’ market leverage. Between September 16th and 17th, the Open Interest rates saw a significant decline. This shows that the demand for LTC is gradually sinking and may contribute to a price decline in the long run.
Litecoin’s Accumulative Swing Index (ASI) retreated but still remained positive, indicating that the long-term trend was still an uptrend. It is also worth noting that a negative ASI will suggest that the pullback translates into a downtrend.
Subscribe to our daily newsletter!
No spam, no lies, only insights. You can unsubscribe at any time.


