

- On-chain indicators point to a necessary “reset”, with which the Bitcoin price could build new bullish momentum.
- The correlation between Bitcoin and the S&P500 is currently “higher than the historical norm”, which poses a risk for the coming days.
The crypto market is showing signs of recovery after Bitcoin experienced its worst week since the market collapse in March 2020. Over the past week, BTC’s price plummeted by about 25%. At the time of writing, the price managed to climb back into the key support zone of $46,000 to $48,000, with BTC trading at around $47,400, up 5.4% over the past 24 hours.
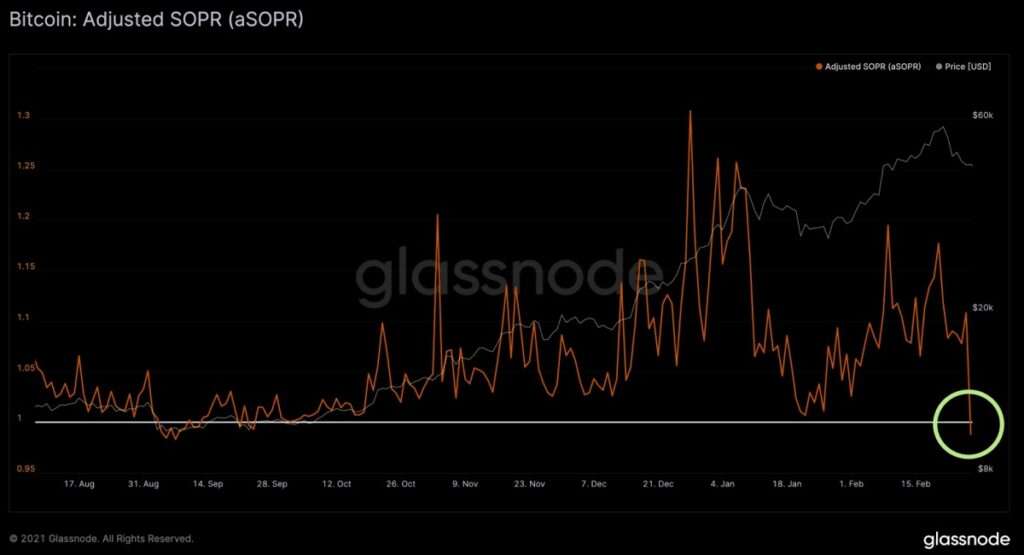
And as various on-chain metrics showed, the worst may be over now. Analytics firm Glassnode stated that the “on-chain net realized loss” reached its lowest level since April 2020 on Saturday, standing at $243 million. In addition, the daily “Bitcoin Spent Output Profit Ratio” (SOPR) has seen a complete reset, turning negative for the first time in five months.
“Investors were on average moving BTC at a slight loss, indicating profit-taking has abated,” as Glassnode elicited.
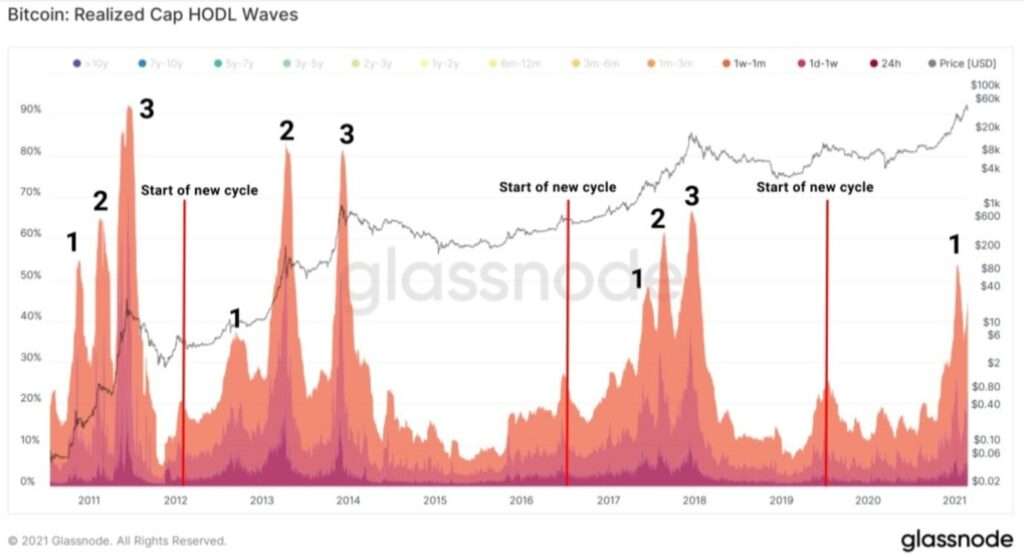
As Lenmarkk Magello explained via Twitter, the “Realized Cap HODL Waves” indicator is confirming Glassnode’s theory that there has been a “reset” and that the first wave in the current cycle has reached its end. The indicator aims to identify extremes in market psychology over time to accurately identify the highs and lows of the global bitcoin cycle.
To do this, it analyzes coins that have recently moved on a short time frame, versus those that have recently moved much further in the past and on a longer time frame (1-2 years ago). The current data shows “the end of the first wave. The second wave is following. Wow,” wrote Magello.
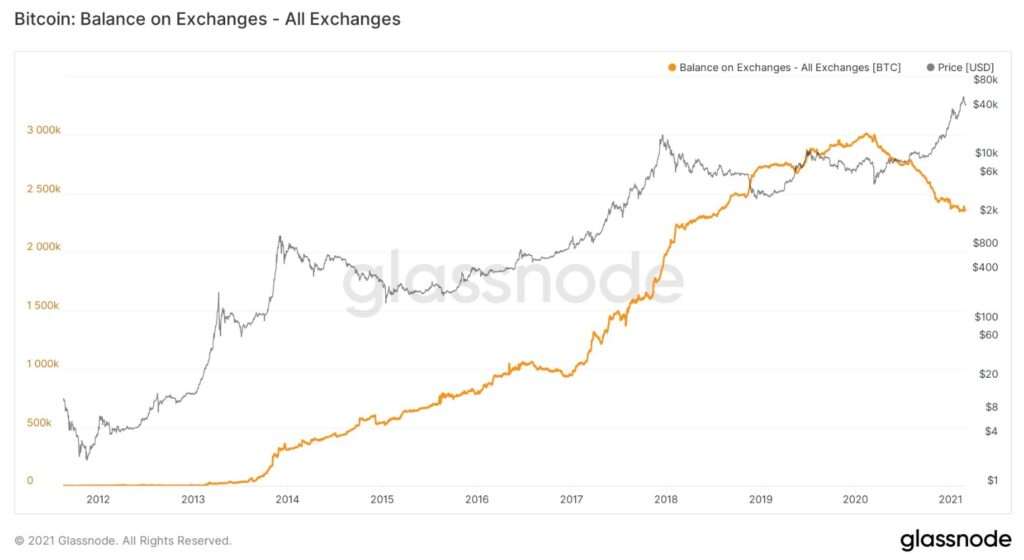
Meanwhile, technical analyst Michael von der Poppe, citing on-chain data from Glassnode, stated that “even in this correction, Bitcoin’s outflow from exchanges is still strong.” Further, he concluded:
This means that people are buying their #Bitcoin to hold in cold storage as an investment vehicle and those are not selling. We’re still early. In a healthy correction.
Correlation with the S&P500 a danger?
Contrary to these bullish metrics, however, the analytics firm Santiment also pointed out a “danger” for Bitcoin today. The correlation between Bitcoin’s price and the traditional stock market, specifically the S&P500, is currently “higher than the historical norm.”
As we’ve noted in previous data studies, $BTC‘s rallies tend to be the most prominent when this correlation turns negative, as it did in December, 2020.

Recommended for you:
- Buy Bitcoin Guide
- Bitcoin Wallet Tutorial
- Check 24-hour Bitcoin Price
- More Bitcoin News
- What is Bitcoin?
Subscribe to our daily newsletter!
No spam, no lies, only insights. You can unsubscribe at any time.

