
 All news is rigorously fact-checked and reviewed by leading blockchain experts and seasoned industry insiders.
- The Bitcoin price has briefly broken through the USD 10,000 mark and could now, according to the analysis of some experts, reach the USD 10,500 mark.
- Ethereum has also crushed a very important resistance at $307 and thus could prepare for a rally to above $400.
Since the beginning of May, the Bitcoin price has been caught in a sideways movement below the massive resistance zone between USD 10,000 and USD 10,500. However, this could possibly change soon. Currently, the Bitcoin price is starting to cross this resistance zone again. After the price has already risen continuously over the past few days from below USD 9,200, Bitcoin shows a rise of around 4% on today’s chart and is trading at USD 9,980 at the time of writing. Temporarily BTC already reached a daily high of USD 10,195.
As numerous analysts have stated, today’s Sunday could be a turning point. As Josh Rager stated on Twitter, the first step for Bitcoin is to break through the resistance of $9,700 on the daily chart. If this happens, a close above $10,000 on the weekly chart would be the next extremely bullish indicator that could catapult the BTC above the $10,500 level in the long term.
https://twitter.com/Josh_Rager/status/1287081696324734982
Especially in the USD 9,800 range, there was strong selling pressure, which Bitcoin was able to overcome seemingly effortlessly. Another respected analyst, Flood [BitMEX], commented on the importance of this level in a recent tweet. He stated yesterday that Bitcoin is currently in a macro range between $8,800 and $9,800 and that exceeding this level will trigger a “textbook swing” to 10,500.
Still in this month long range 8.8-9.8k. I try to avoid taking new positions in the middle of a pretty defined range so will be holding off for now. Stalling here would not be very bullish but a break above 9.8k should be a pretty textbook swing to 10.5k.
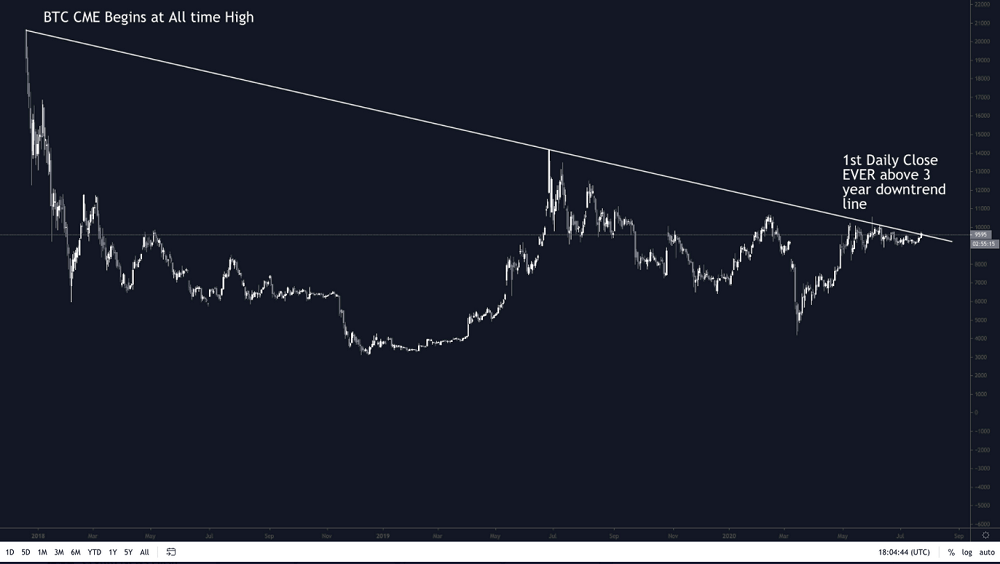
Already yesterday, the chief analyst of Blockfyre also pointed out that the price level of Bitcoin Futures on the CME has broken through a decisive level. As he explained by means of the chart below, yesterday’s close at around $9,600, BTC broke the three-year downtrend line in Bitcoin’s CME Futures daily chart for the first time:
Bitcoin just had it’s first daily close ever ABOVE the 3 year downtrend line from ATH’s when CME Futures launched. This is potentially an invalidation with a HH of any bearish case and the official start of a new macro bull trend.
Ethereum rises 11%, breaks through USD 310
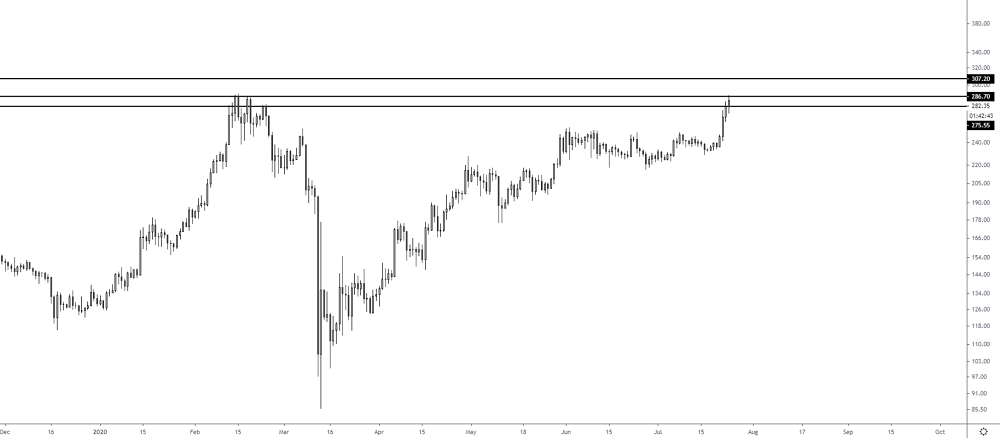
Not only Bitcoin, but also the second largest cryptocurrency by market capitalization, Ethereum, is currently printing massive bullish signals. At the time of writing, Ethereum has risen by nearly 10% in the last 24 hours and is trading at 310 USD. Thus, Ethereum has risen just above the massive resistance at USD 307. As Josh Rager noted yesterday, closing above this level could open the gates for a rally to over $400:
Daily resistance around $286 and no close here means potential pullback, before the next test But above that around $307 is the big test Once $ETH breaks and closes above $307 – I don’t see long until it hits over $400 – at least on higher time frames.
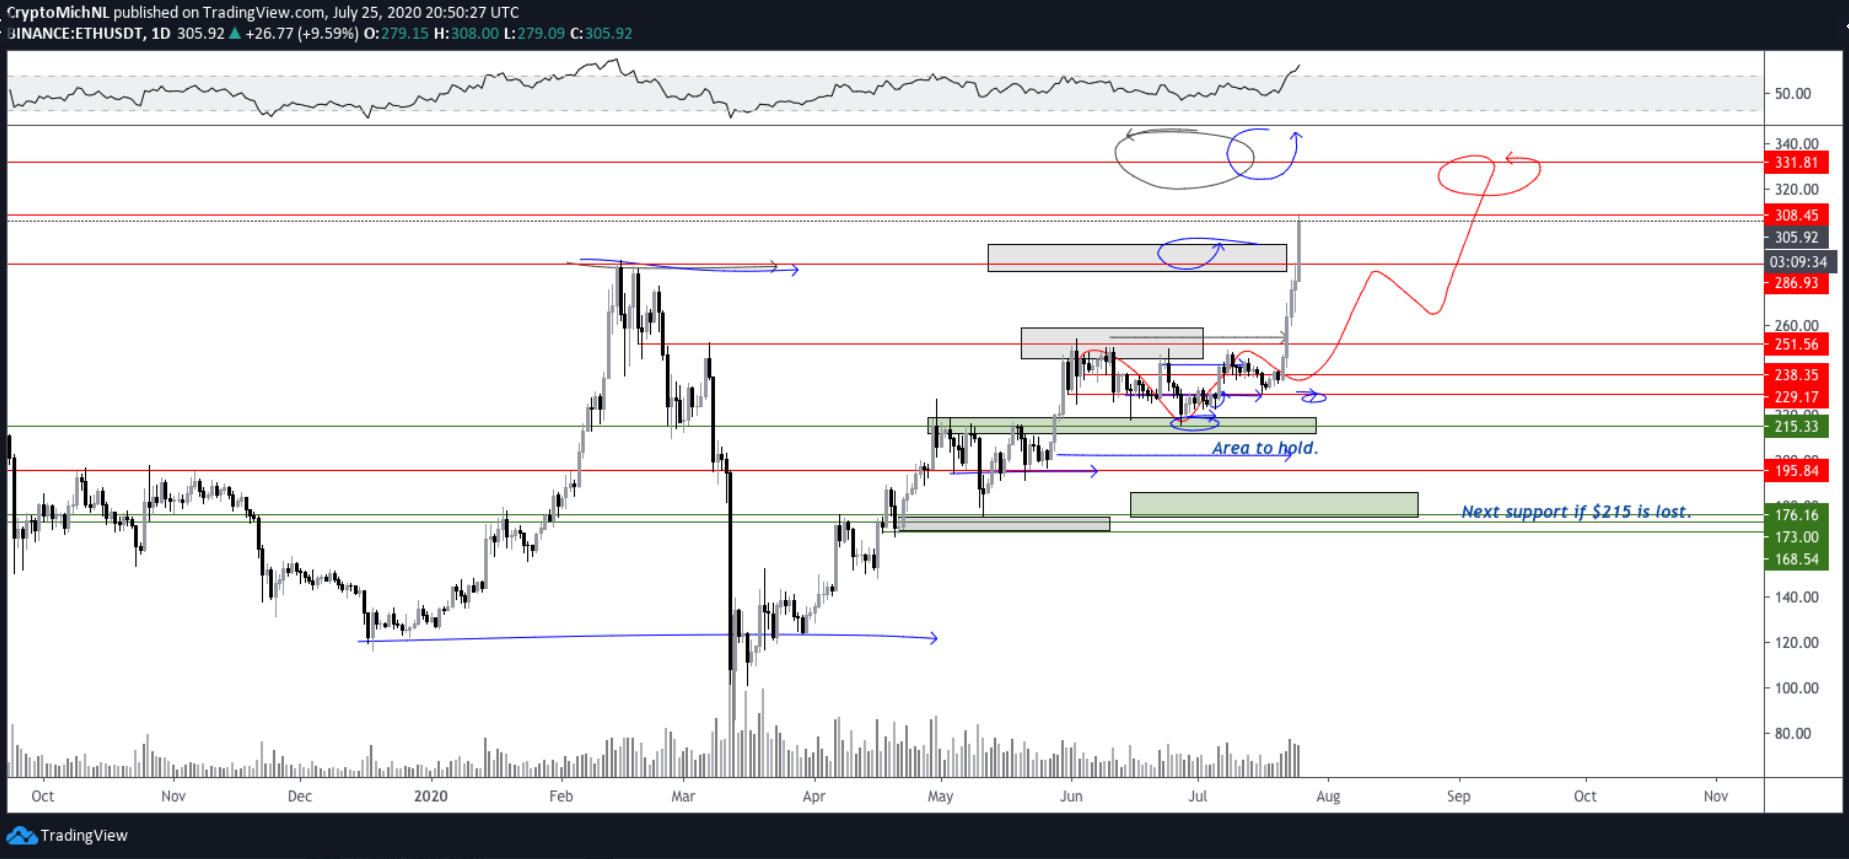
A similar analysis was shared by analyst Michael van de Poppe, who described USD 308 as the resistance of ETH that must be overcome on the way to USD 400.
Going a little higher than the plan initially was, a month ago. But we’re doing fine. Might be on the resistance at the $308 level. But that’s basically final hurdle before $400+, to me.