

 All news is rigorously fact-checked and reviewed by leading blockchain experts and seasoned industry insiders.
- The Bitcoin price is currently writing an extremely bullish signal with the Wyckoff accumulation chart pattern.
- Most recently, Bitcoin showed the chart pattern in early January of this year. As a result, the price rose from under 7,000 USD to over 10,000 USD.
After the bears dominated the Bitcoin price in the last two weeks of February, when BTC fell from over USD 10,300 to just under USD 8,400, the bulls seem to be taking the wheel again in March. The downward trend was attributed to the global uncertainty caused by the coronavirus, as a result of which the stock market also recorded the largest losses in years. Since 2 March, however, the BTC price has risen from below USD 8,500 to its current level (at the time of writing) of USD 9,113.
According to analyst Tyler D. Coates, this upward trend could continue. Bitcoin has shown an extremely bullish sign in the last few days. As in early January, when Bitcoin rose from under 7,000 USD to over 10,000 USD within a month, Bitcoin’s 4-hour chart is once again showing the Wyckoff accumulation chart pattern.
Is the long-awaited Bitcoin bullrun coming?
A Wyckoff accumulation is a chart pattern observed by the legendary analyst Richard Wyckoff where an asset enters an accumulation area and then rises sharply higher than the previous decline. According to Coates, who uploaded a chart to demonstrate Bitcoin‘s position, the largest cryptocurrency has already hit a low.
Bitcoin is already in Phase D of the chart pattern. Typically, Phase D is characterized by a significant increase in trading volume and volatility. In addition, there is usually a Last Point Support (LPS), a higher low before the market rises higher. The LPS often precedes a breakout in resistance levels, which in turn leads to higher highs. This indicates a Sign of Strength (SOS), as the previous resistance levels become support.
Yesterday’s rise to over $9,000 was an “SOS” point for BTC/USD in Wyckoff terms, as Coates noted. The SOS is typically followed by a small drop in price, called a “back-up”, before new price gains are made.
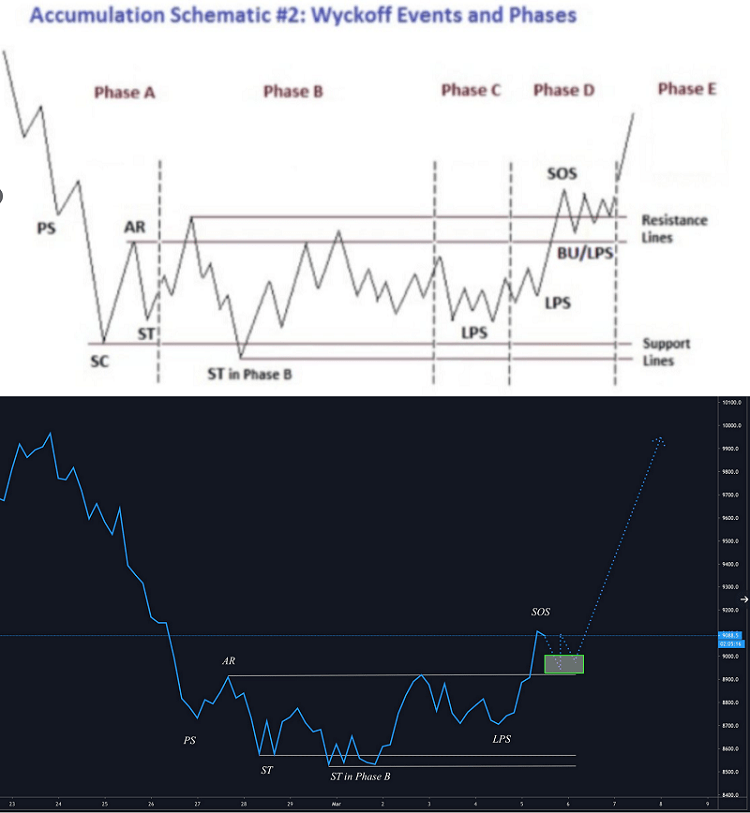
This happens in phase E, the last stage of the accumulation scheme. It is characterized by a significant breakout above the resistance level, causing increased market demand. At this point, the trading range is effectively breached and the upward trend begins.
Coates, via Twitter, notes that Bitcoin remains strong despite the absence of a spring, which is often seen as the last bear trap before the market begins to reach higher lows, which Wyckoff’s accumulation confirms:
Still viewing this as Wyckoff Accumulation but using a different schematic after $BTC broke through resistance without a spring. Failing to get a spring is a strong sign & shows that bulls are starting to take control. Buying $8,950 with a $8,694 stop provides great r:r.
The thesis that there is an accumulation of Bitcoin is also supported by a recent study by the crypto exchange Kraken. In a study Kraken found that the number of addresses with a high number of Bitcoin, crypto whales (1,000 to 10,000 BTC) and HODLer (10-100 BTC), increased significantly in the second half of January 2019.
Whether Bitcoin will follow the chart pattern, however, remains to be seen. From a fundamental data perspective, there were two bullish news last week. The Supreme Court in India has lifted the quasi-ban on cryptocurrencies imposed by the country’s central bank. In addition, the South Korean parliament passed a law that for the first time introduces a legal framework for Bitcoin (BTC) and others.
Follow us on Facebook and Twitter and don’t miss any hot news anymore! Do you like our price indices?