

 All news is rigorously fact-checked and reviewed by leading blockchain experts and seasoned industry insiders.
- Ethereum technical chart set up with double bottom formation hints at trend reversal and strong buying interest.
- On-chain data reveals a surge in buying interest for Ethereum among US-based crypto whales trading on Coinbase Pro, reaching a 100-day high.
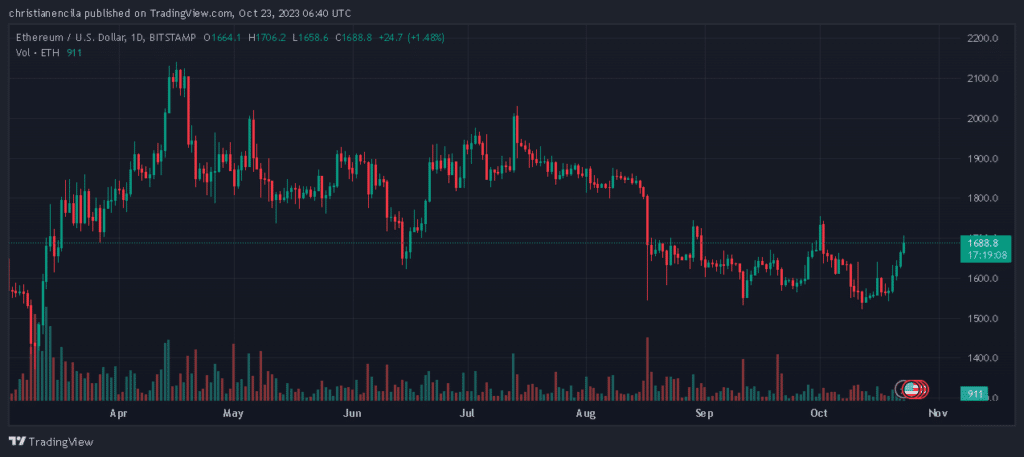
Over the last few days, the world’s second-largest cryptocurrency Ethereum (ETH) has been trying to regain the lost ground after reversing from its crucial support at $1,500. At press time, Ether (ETH) is trading at $1,677 with a market cap of over $200 billion.
Upon examining the daily timeframe, it’s clear that this recovery might indicate the development of a bullish reversal pattern called a double bottom. This classic technical pattern often foreshadows a potential trend reversal, characterized by two price troughs, like Ethereum’s at $1,500, hinting at substantial buying interest. The double bottom pattern suggests that selling pressure from bears may be dwindling while buyers gain control, potentially paving the way for a bullish upturn.
Next ETH Price Resistance
To affirm this resurgence and pave the way for further advancements, Ethereum (ETH) must surpass a critical resistance barrier at $1,745. Achieving a daily candle close beyond this level could trigger an additional 5.2 percent increase, challenging the Double Bottom pattern’s neckline.
Recent price analysis suggests that breaching this neckline would furnish robust confirmation of a sustained recovery, potentially unlocking a path toward the $2,000 milestone, signifying an approximate 14.5 percent rise.
Despite the optimistic short-term outlook for Ethereum, vigilant attention is needed for price action around the $1,745 resistance. The current corrective trend remains intact until Ethereum surpasses its previous peak. Should supply pressure intensify at this resistance, it may lead to further consolidation or even a continuation of the sideways trend.
If buyers cannot conquer this barrier, Ethereum may retrace southward, with a possible target of the psychological level at $1,000. Such a descent would entail a significant 38 percent drop from its current position.
While Ethereum’s recent price action and the appearance of the double-bottom pattern provide optimism, the road ahead is not without obstacles, chiefly revolving around the $1,745 resistance. Traders and market participants should diligently observe these crucial levels and price dynamics as Ethereum charts its course toward potential recovery or further decline in the coming days.
Ethereum Draws Institutional Interest
Amid the recent price resurgence, on-chain data shows that institutional interest has been moving away from Bitcoin (BTC) to Ethereum (ETH). Recent on-chain data reveals that large-scale cryptocurrency traders based in the United States, trading on the Coinbase Pro platform, have heightened their buying activity in Ethereum (ETH) to its highest level in the past 100 days. In contrast, their interest in Bitcoin (BTC) has waned since last Thursday.
The Coinbase Premium Index chart, provided by CryptoQuant, measures the percentage difference between the prices of Ethereum on the Binance and Coinbase exchanges. This metric holds significance due to Binance’s substantial global retail trading volumes, while Coinbase Pro caters more to regulated US-based corporate entities and high-net-worth investors.
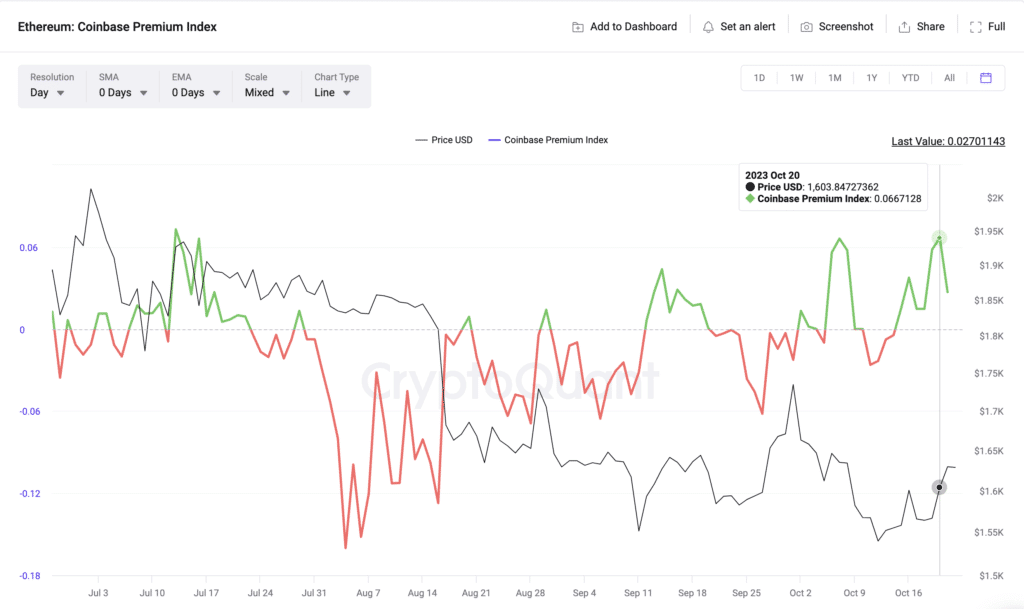
When the Coinbase Premium Index metric turns green or positive, it indicates that the Ethereum price on Coinbase surpasses, even if slightly, the prices listed on Binance. Notably, on October 20, this index reached an unusually high positive value, reaching a 100-day peak of 0.067 percent.