
 All news is rigorously fact-checked and reviewed by leading blockchain experts and seasoned industry insiders.
- Bitcoin has broken key resistance levels with bullish on-chain indicators, positioning it to potentially hit $100,000 soon.
- Technical patterns like double bottom and falling wedge breakouts suggest strong momentum and higher targets above $100K.
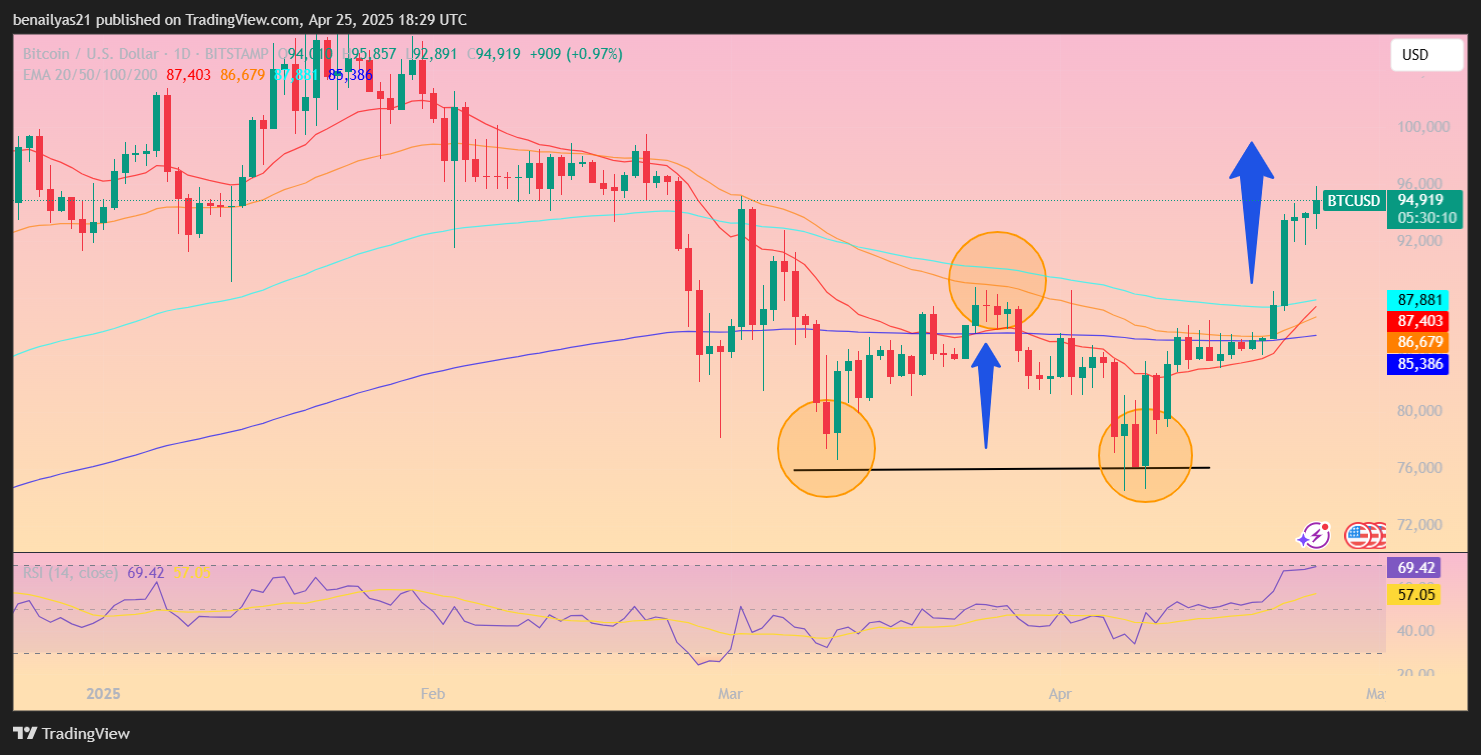
Bitcoin price has reversed from its 20-day-long bearish trend starting from April 2025. The U-turn has pushed its price beyond the $95,000 level, along with the 12% gain in the last week. All these setups are hinting at even a $100k price level soon. Many on-chain indicators are bullish, with recent indications of 87.3% of Bitcoin’s circulating supply on April 23 surging from its 82.7% during early March, as per Glassnode.
The accumulation phase indicates that holders are now back in profit, which often leads to stronger market confidence. When the percentage of supply in profit stays consistently above 90%, historical data suggests markets can move into a euphoric state. With numbers now approaching that level, positive sentiment is firmly in place.
A strong push above the $94,000–$95,000 zone remains crucial. This range is now acting as a cap on Bitcoin’s upward movement. Once breached, analysts expect the full projected move to $100,000 to come swiftly, driven by both technical and liquidity factors.
Breakout Structures Point to $100K Target
Technical signals also favor an upward move. Bitcoin’s daily chart has completed a classic double bottom, with a neckline breakout at $87,668. This structure targets a measured move that could take BTC above $100,500. Supporting indicators such as the relative strength index remain in bullish zones, allowing room for further growth.
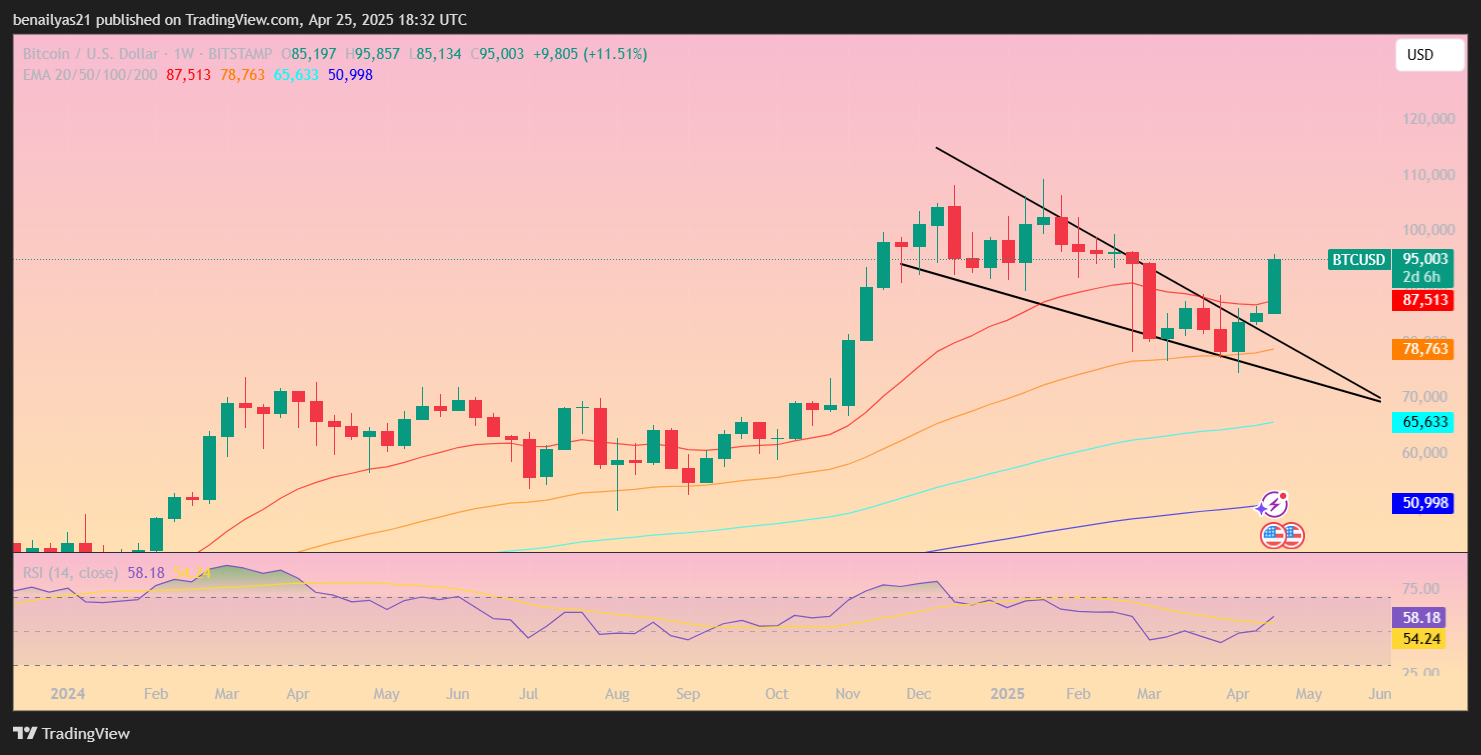
The 50-day and 200-day exponential moving averages have shifted to act as support. This technical transition is viewed as a strong base for additional price momentum. Buyers appear to remain in control, with volume staying consistent after the breakout, forming a steady backdrop for further gains.
Over the shorter term, the hourly chart shows Bitcoin consolidating inside a bull pennant—a pattern that typically signals a pause before the next move upward. The price target from this setup reaches near $100,900, indicating that despite short-term hesitation, longer-term direction remains positive.
Liquidity, Volume, and Market Pressure Create a Bullish Backdrop
The breakout above the falling wedge pattern on the three-day chart adds even more technical conviction. Bitcoin surpassed a significant resistance level around $94,000 and now trades above the 50-3D EMA. The upward move was also accompanied by a spike in volume, which often reflects increased buyer commitment and market interest.
The target from the wedge pattern reaches up to $102,270, reinforcing the idea that there is still room for higher prices. Volume acceleration during this breakout also signals that market participants view this level as a launchpad, not a ceiling.
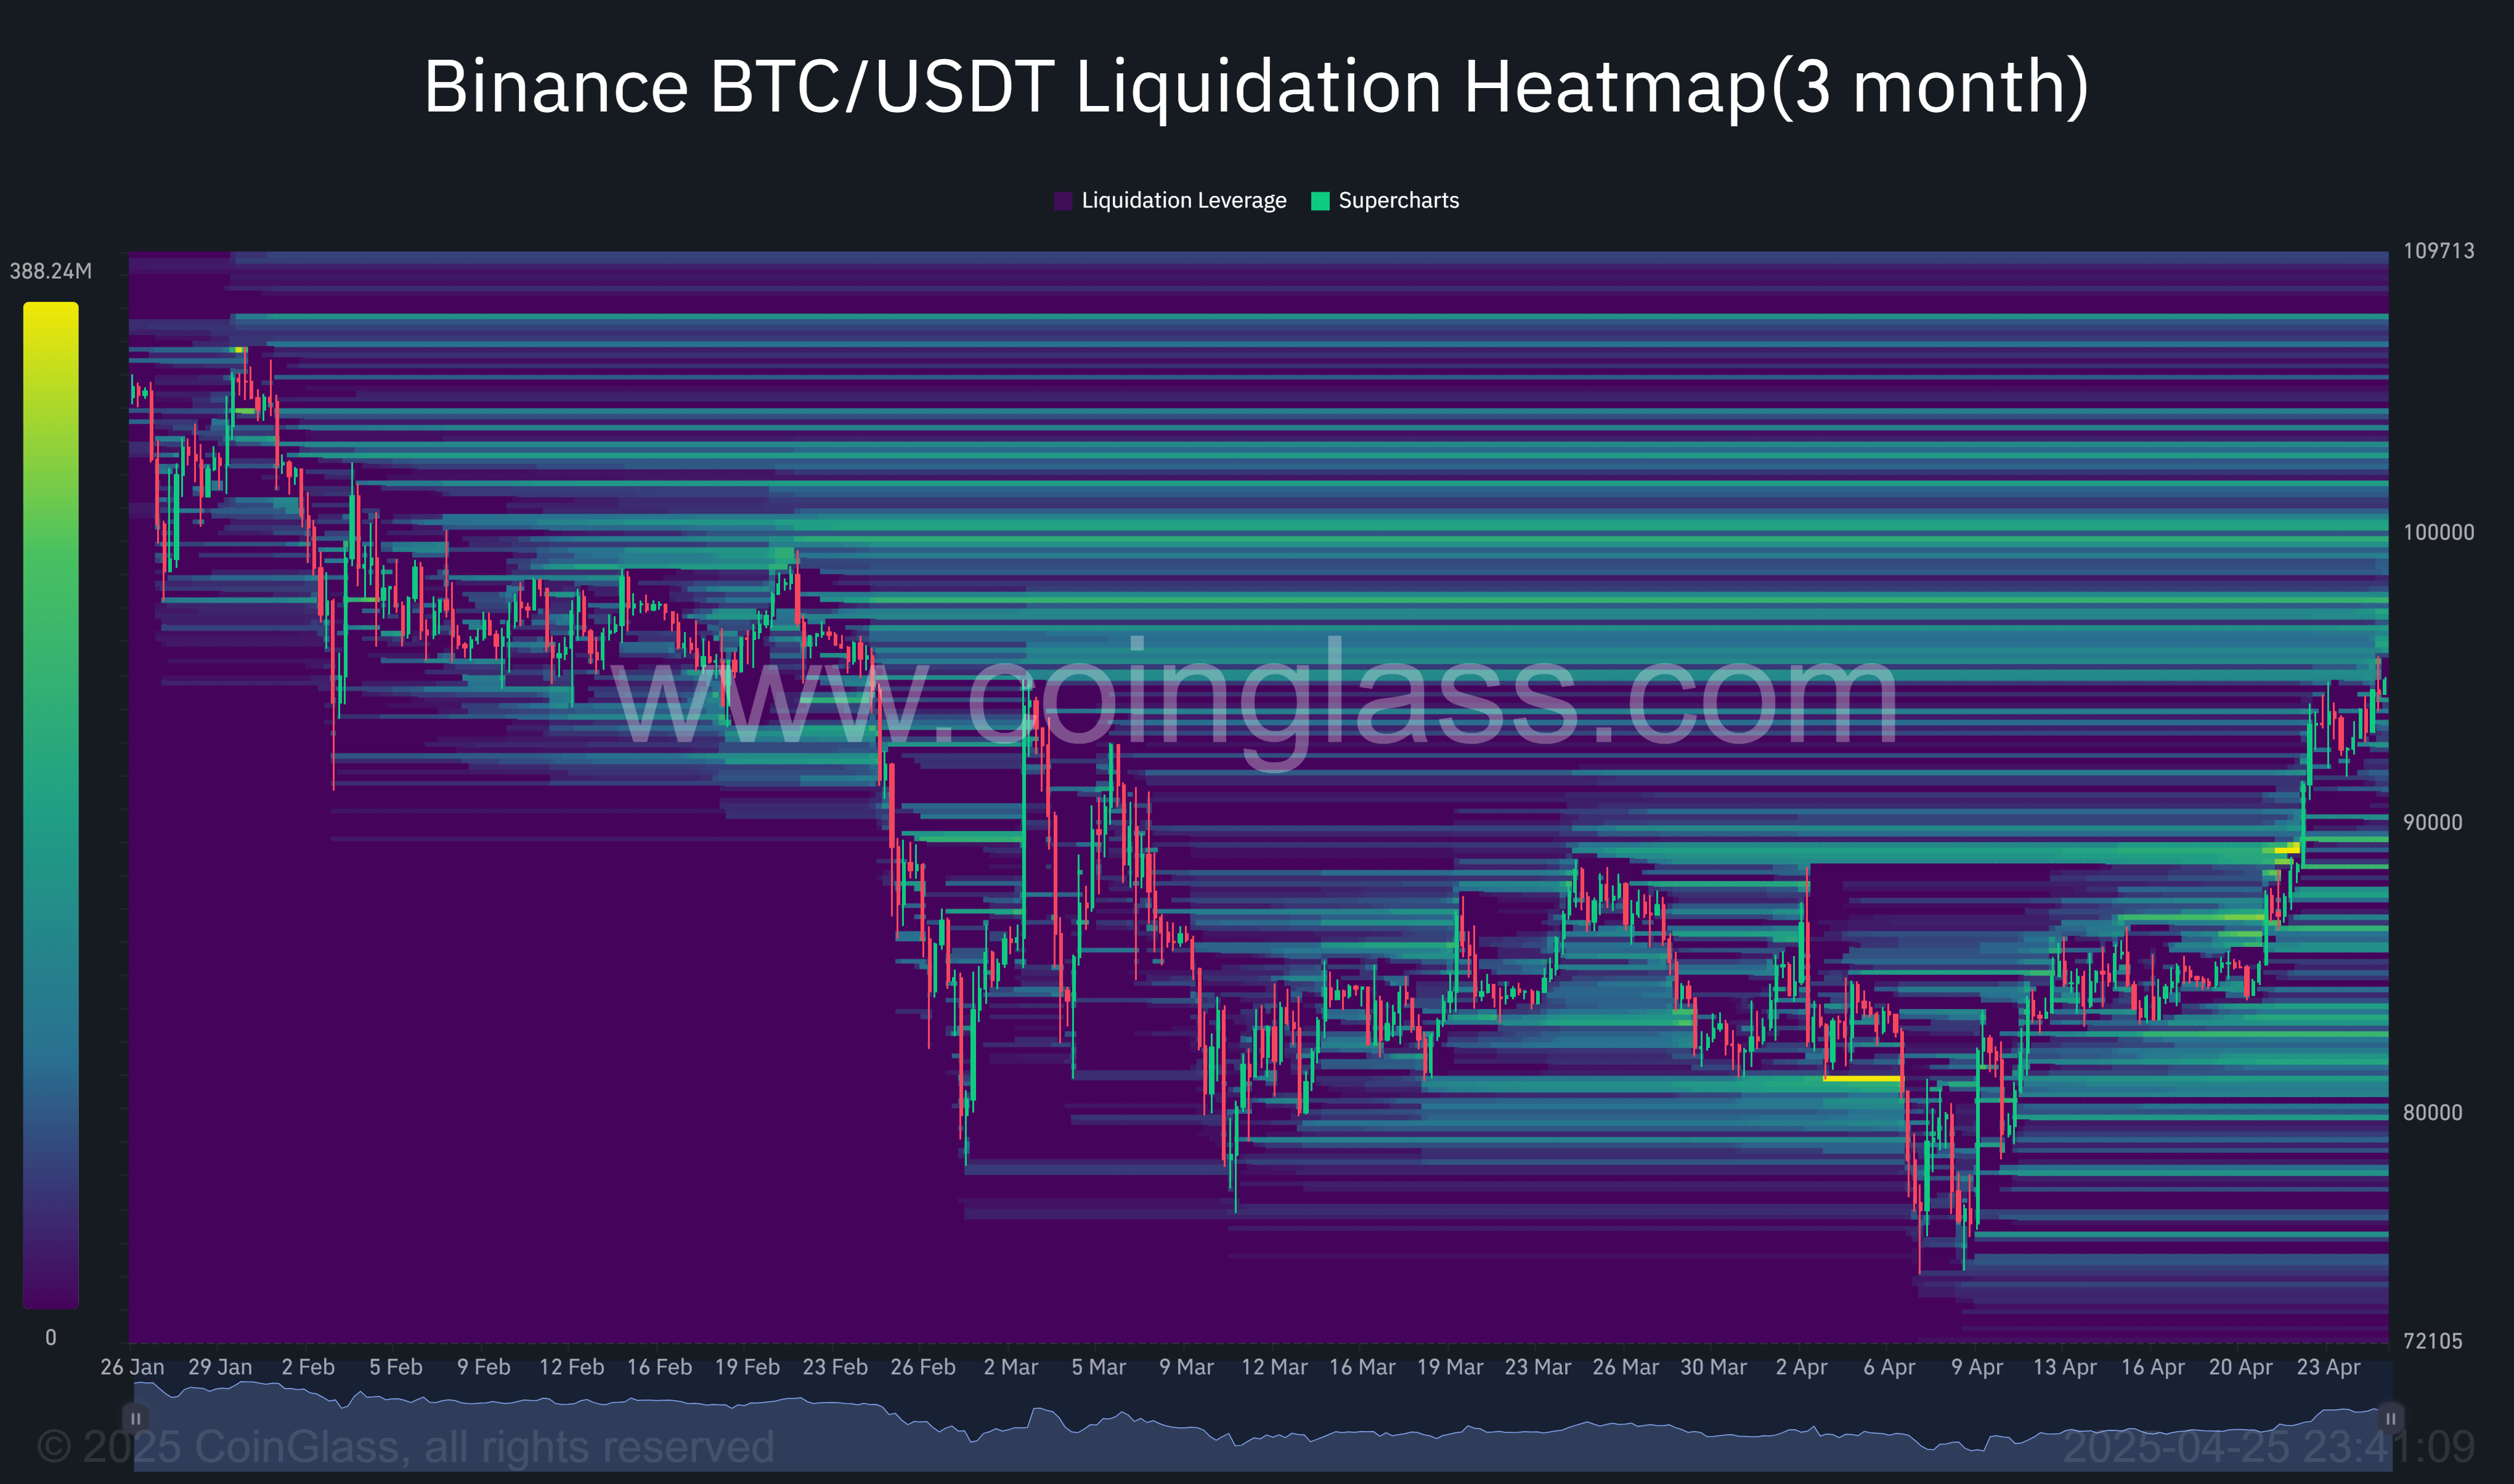
Another layer of support for a bullish outlook comes from liquidation data. Analysis shows a concentration of short liquidations around the $100,000 mark. These levels often act like price magnets. As market makers look for liquidity, such clusters can pull prices toward them, triggering further upward movement.